Overloaded
Yandex Tank Benchmark setup and Detecting memory leaks
January 24, 2019
Sometimes is required to identify the limitations of performance and bottlenecks of an application in order to make the most efficient use of its resources. Detect a memory leaks for you apps may be critical for production environments. Let’s look at how to identify such moments using Yandex Tank benchmark.
Setup Yandex Tank
In first we create directory and config file:
mkdir ~/loadtest && touch load.yamlAdd next configuration to load.yaml:
phantom:
  address: 192.168.20.117:3000 # [Target's address]:[target's port]
  uris:
    - /
  load_profile:
    load_type: rps # schedule load by defining requests per second
    schedule: line(1, 10, 10m) # starting from 1rps growing linearly to 10rps during 10 minutes
console:
  enabled: true # enable console output
telegraf:
  enabled: false # let's disable telegraf monitoring for the first time
Important sections address, uris and schedule. For address key need setup host and port for you tested application.
Then we can start Yandex Tank with using prepared Docker image (if you use macosx - need install Docker for Mac)
docker run -v $(pwd):/var/loadtest -v $SSH_AUTH_SOCK:/ssh-agent -e SSH_AUTH_SOCK=/ssh-agent -v $HOME/.ssh:/root/.ssh --net host -it direvius/yandex-tankAnd see output:
You can create alias for simplify using (for macosx):
echo "alias tank=\"docker run -v $(pwd):/var/loadtest -v $SSH_AUTH_SOCK:/ssh-agent -e SSH_AUTH_SOCK=/ssh-agent -v $HOME/.ssh:/root/.ssh --net host -it direvius/yandex-tank\"" >> ~/.bash_profile && source ~/.bash_profileAnd using one:
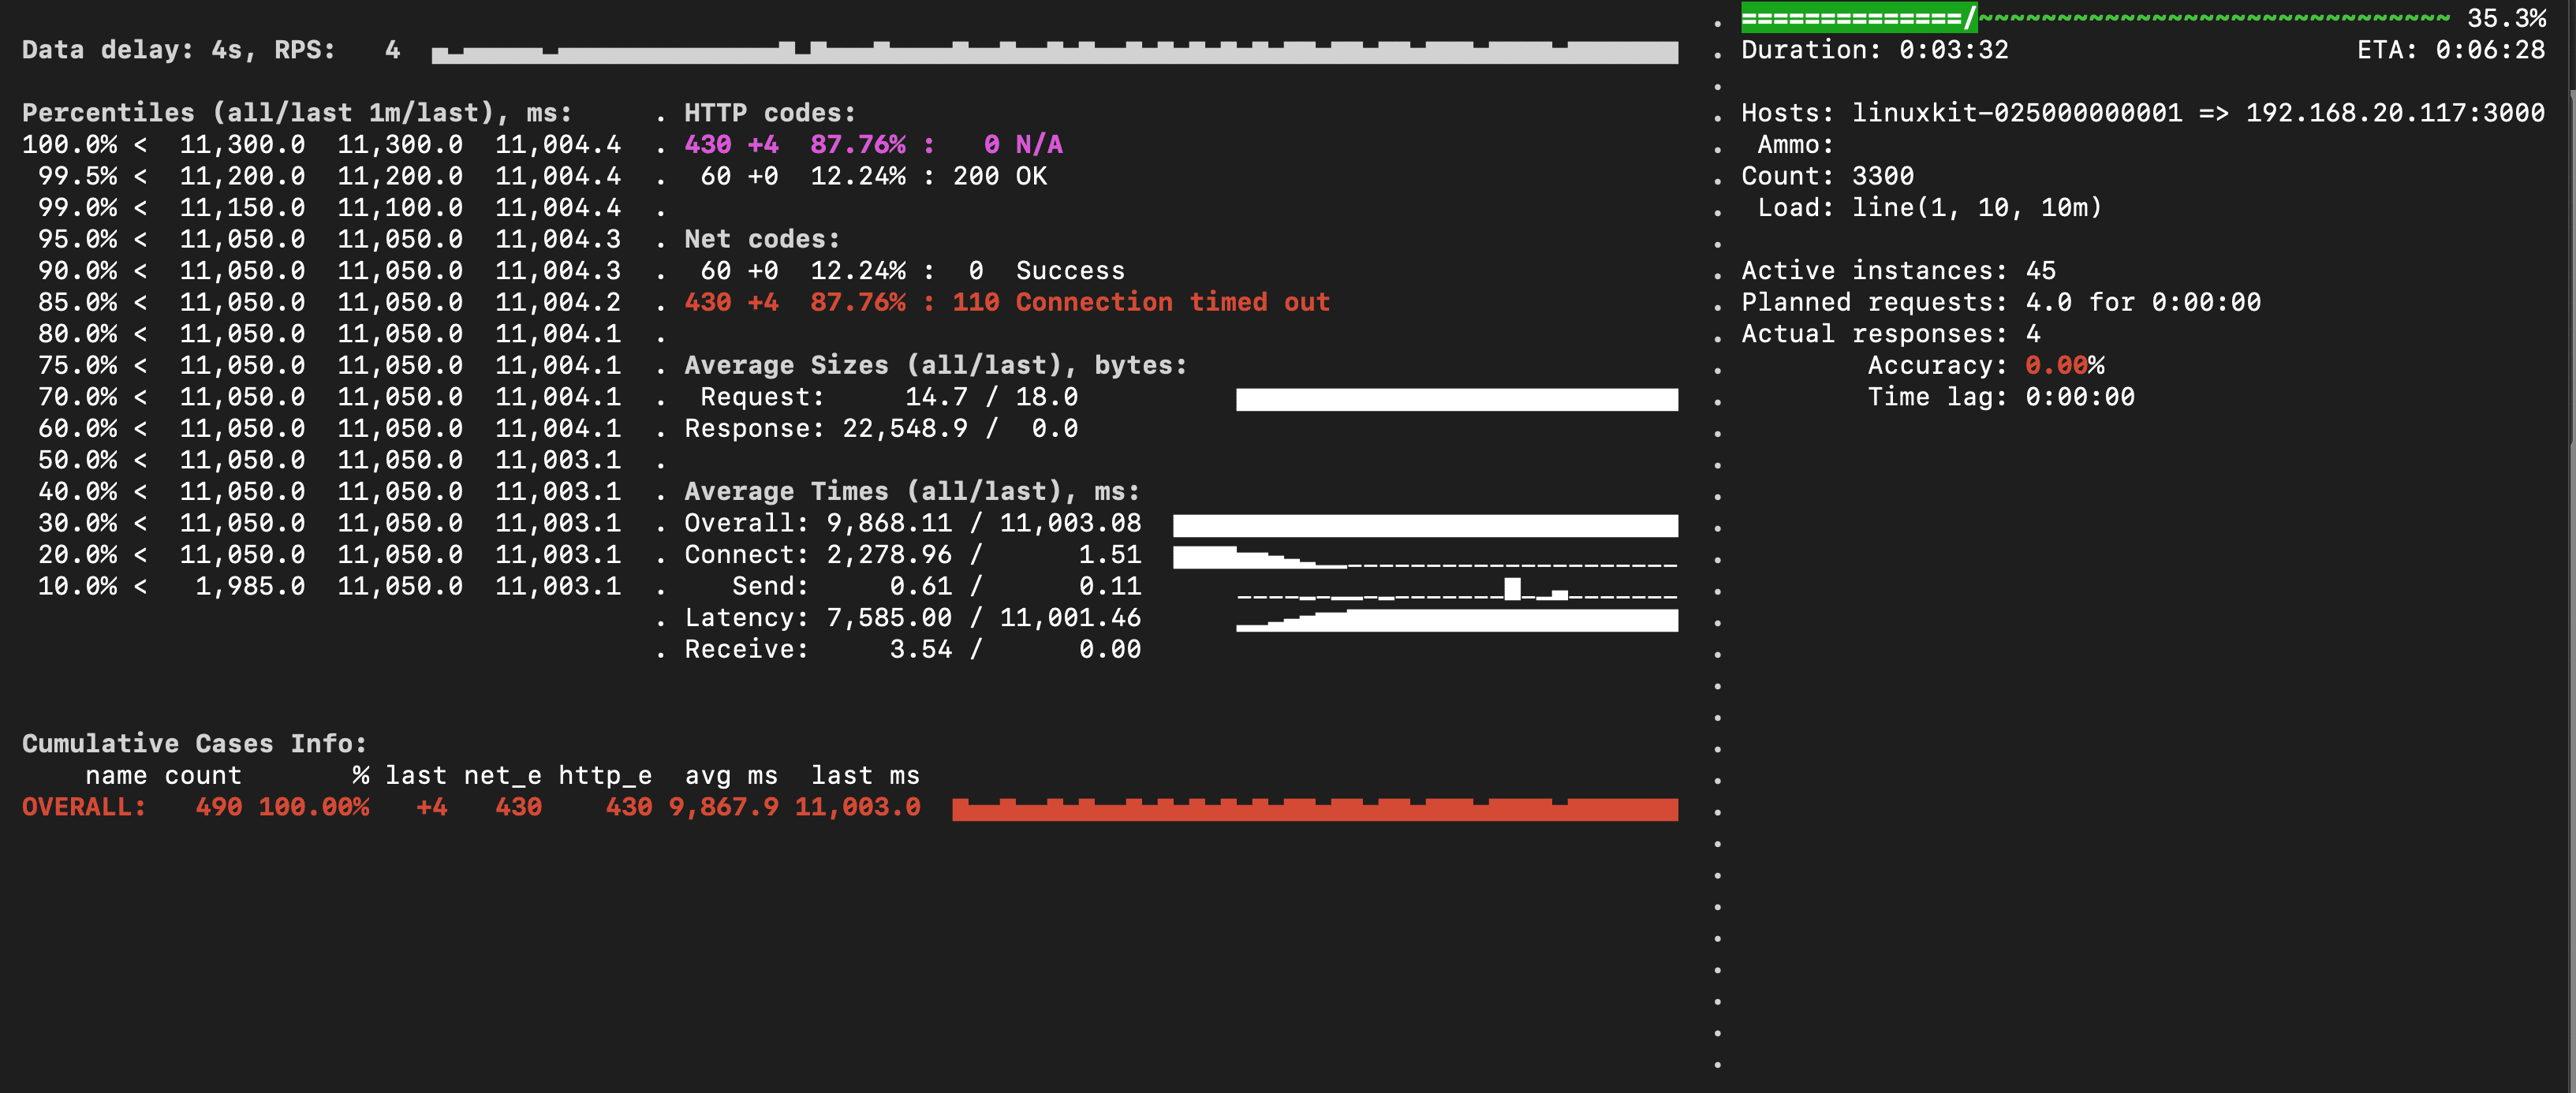
tankVisualizing Data
For visualize load metrics out of the box we can setup the Overload Beta service:
Example view of Quantiles:
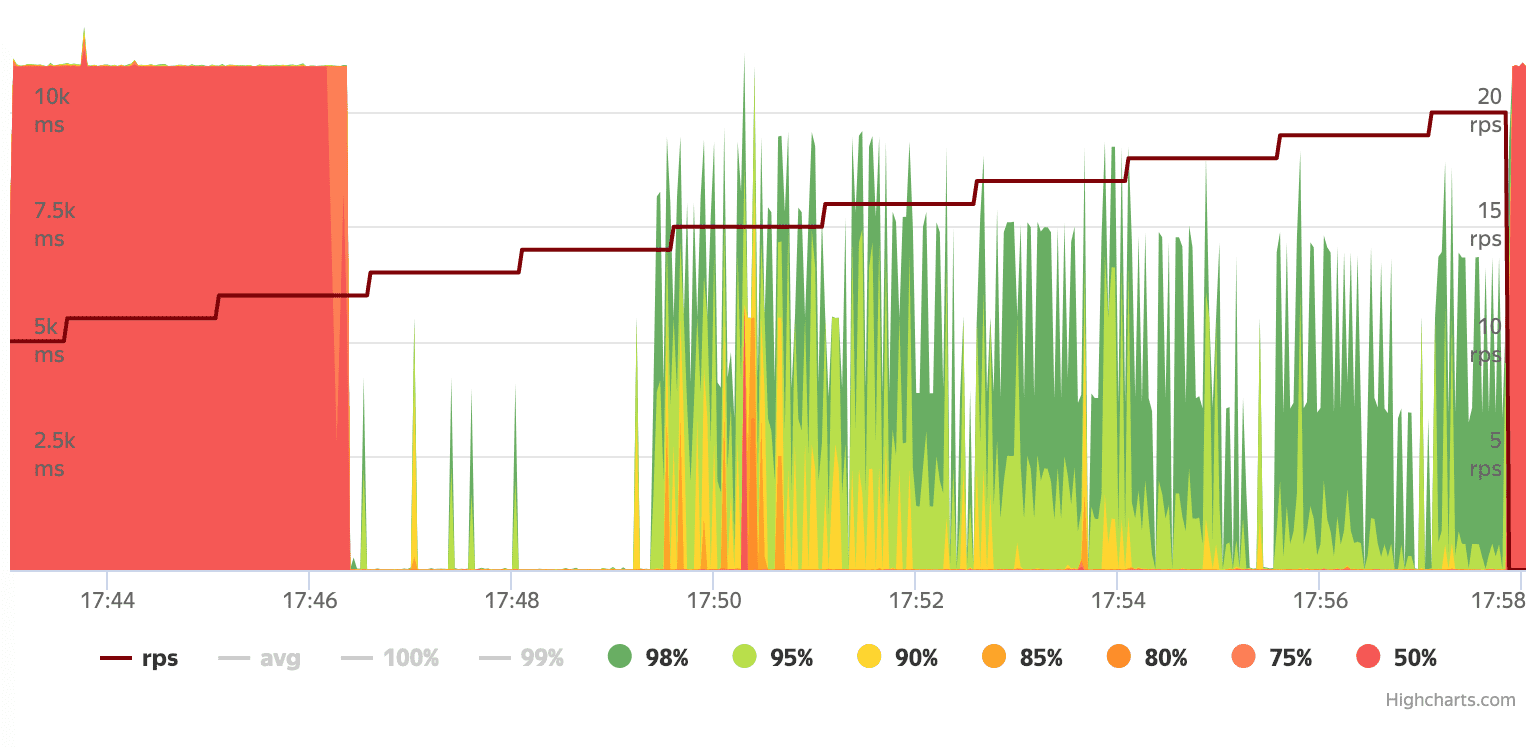
Drawdowns towards the end of the test indicate a restart of the PODs, respectively, memory leaks or high consumption, followed by GC (Garbage Collector) cleaning.
Detecting memory leaks for nodejs apps
pm2 is best Process Manager with a built-in Load Balancer. We can use pm2 for monitoring memory using you nodejs apps.
Install pm2 globally:
npm install pm2@latest -gUsable tips:
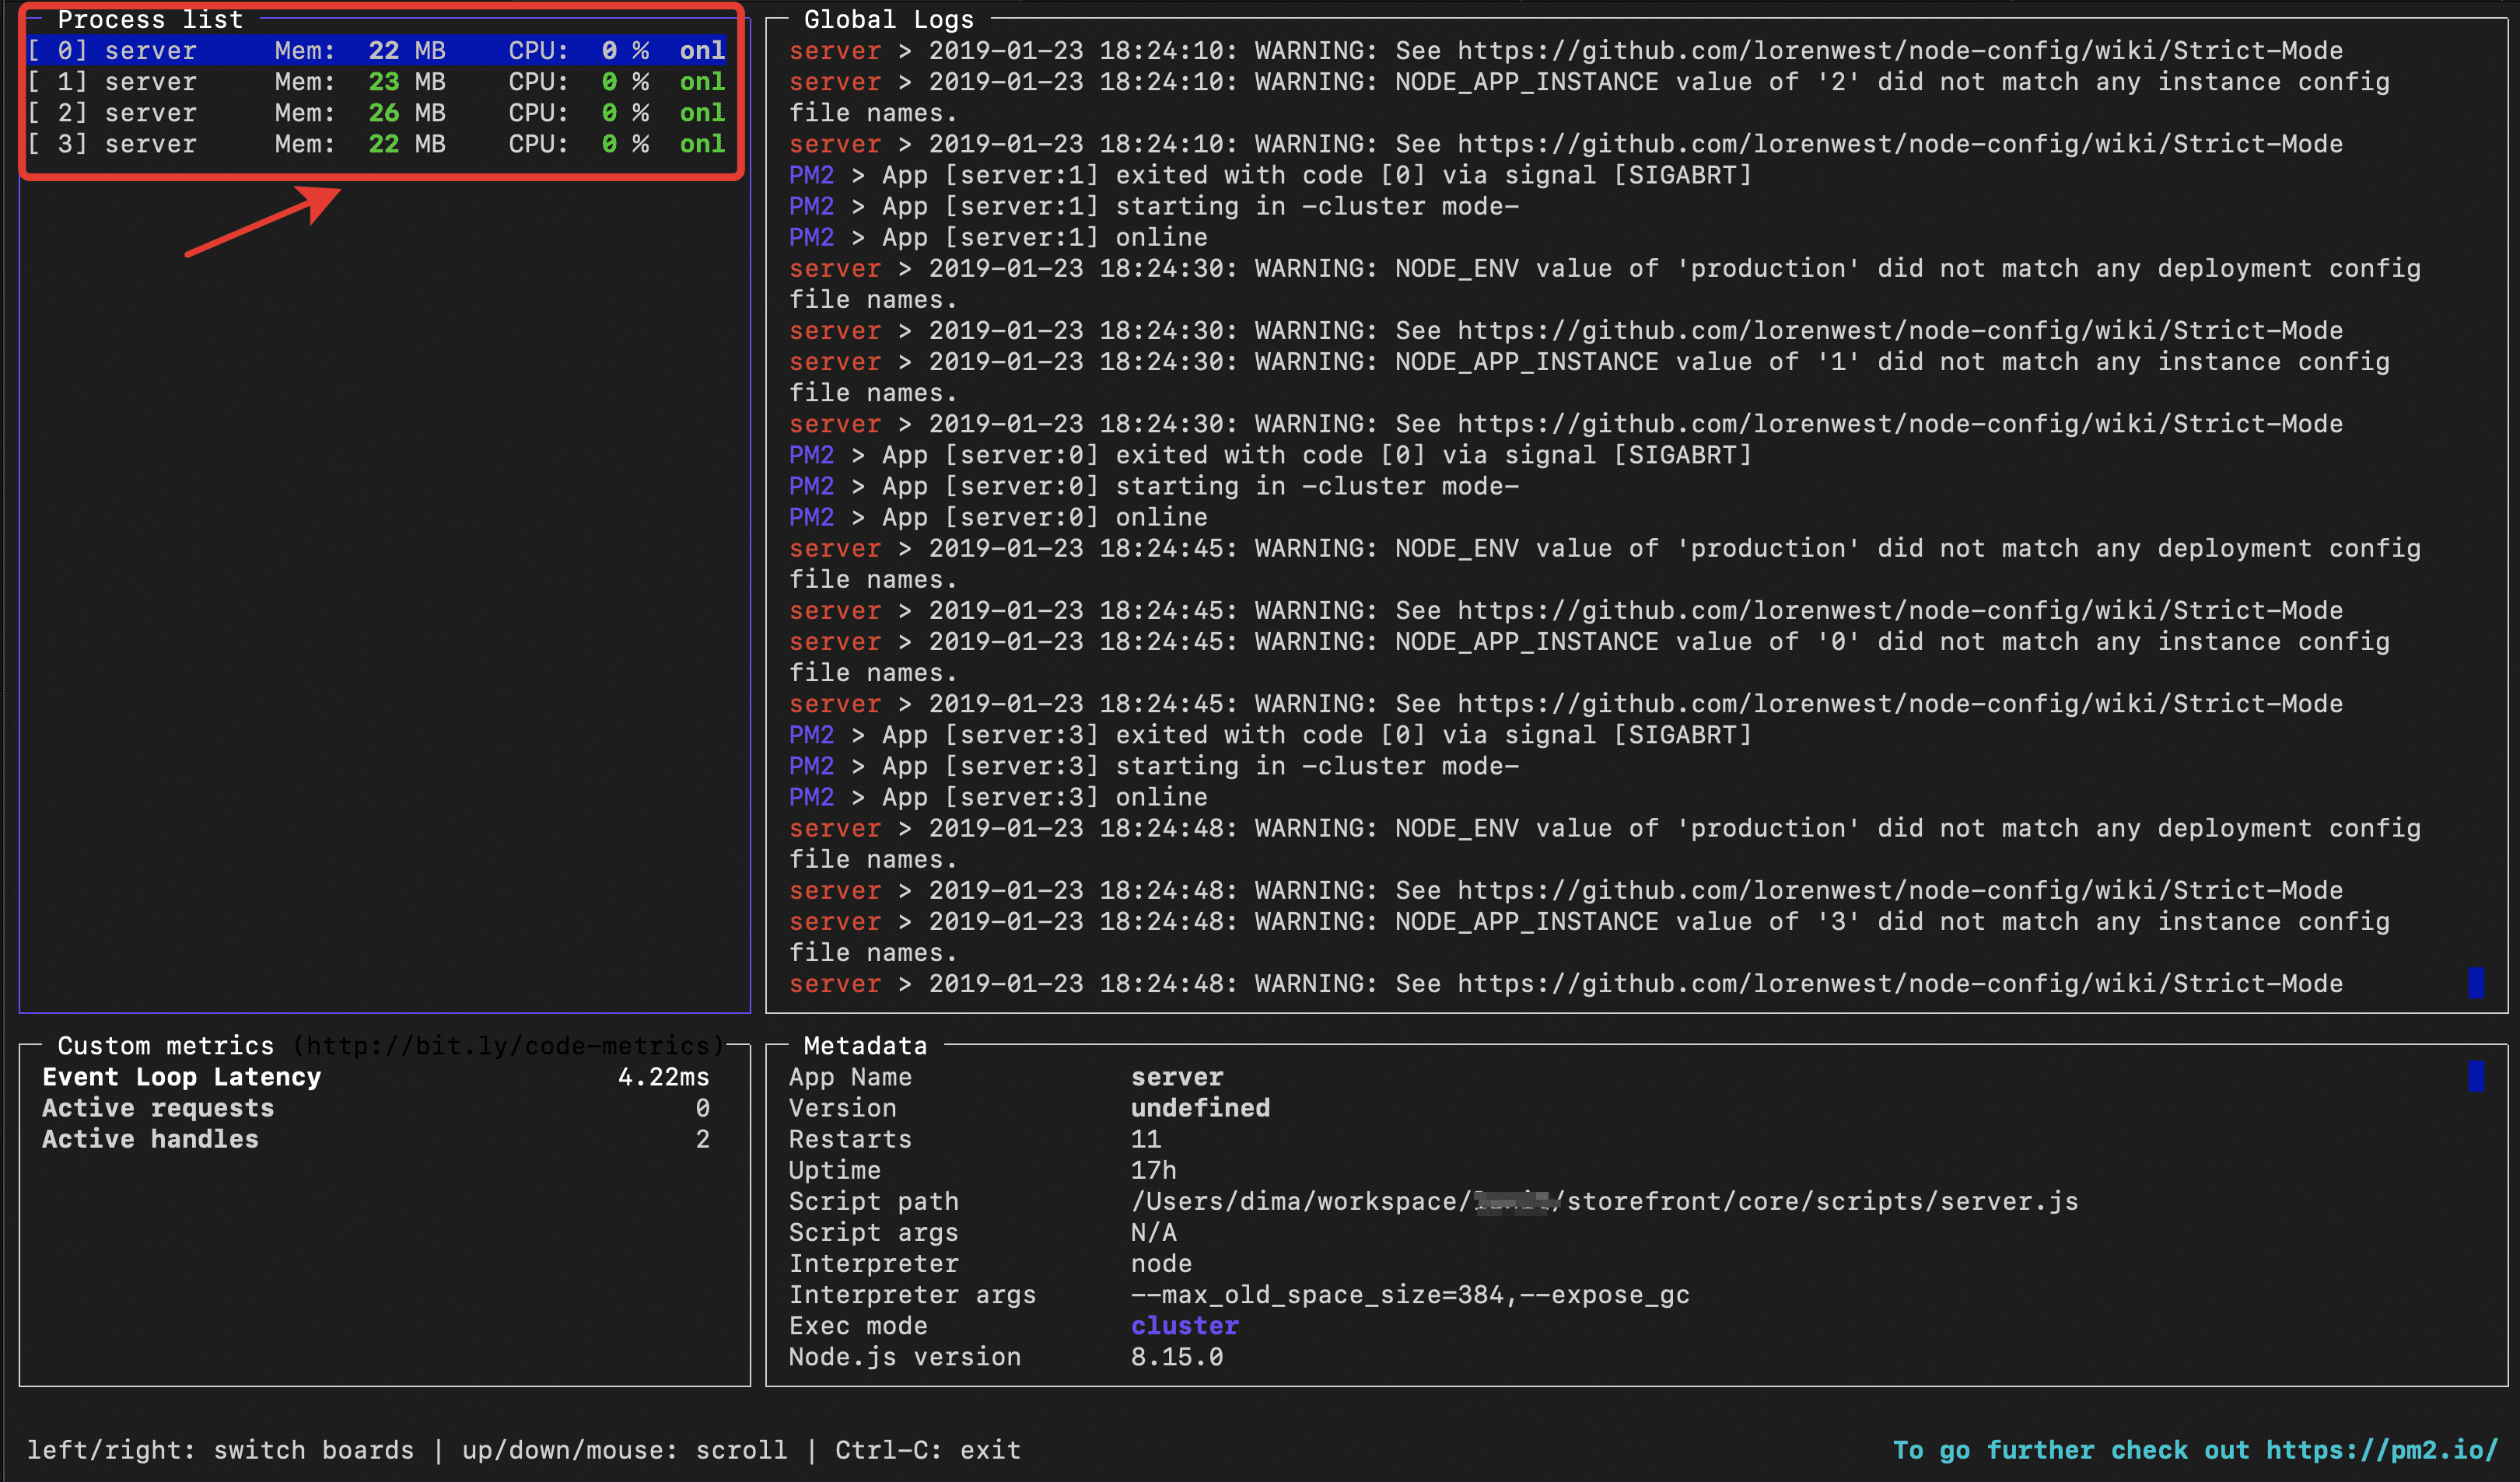
pm2 monit
pm2 imonit
Process List is important section:
Heapdumps analisis
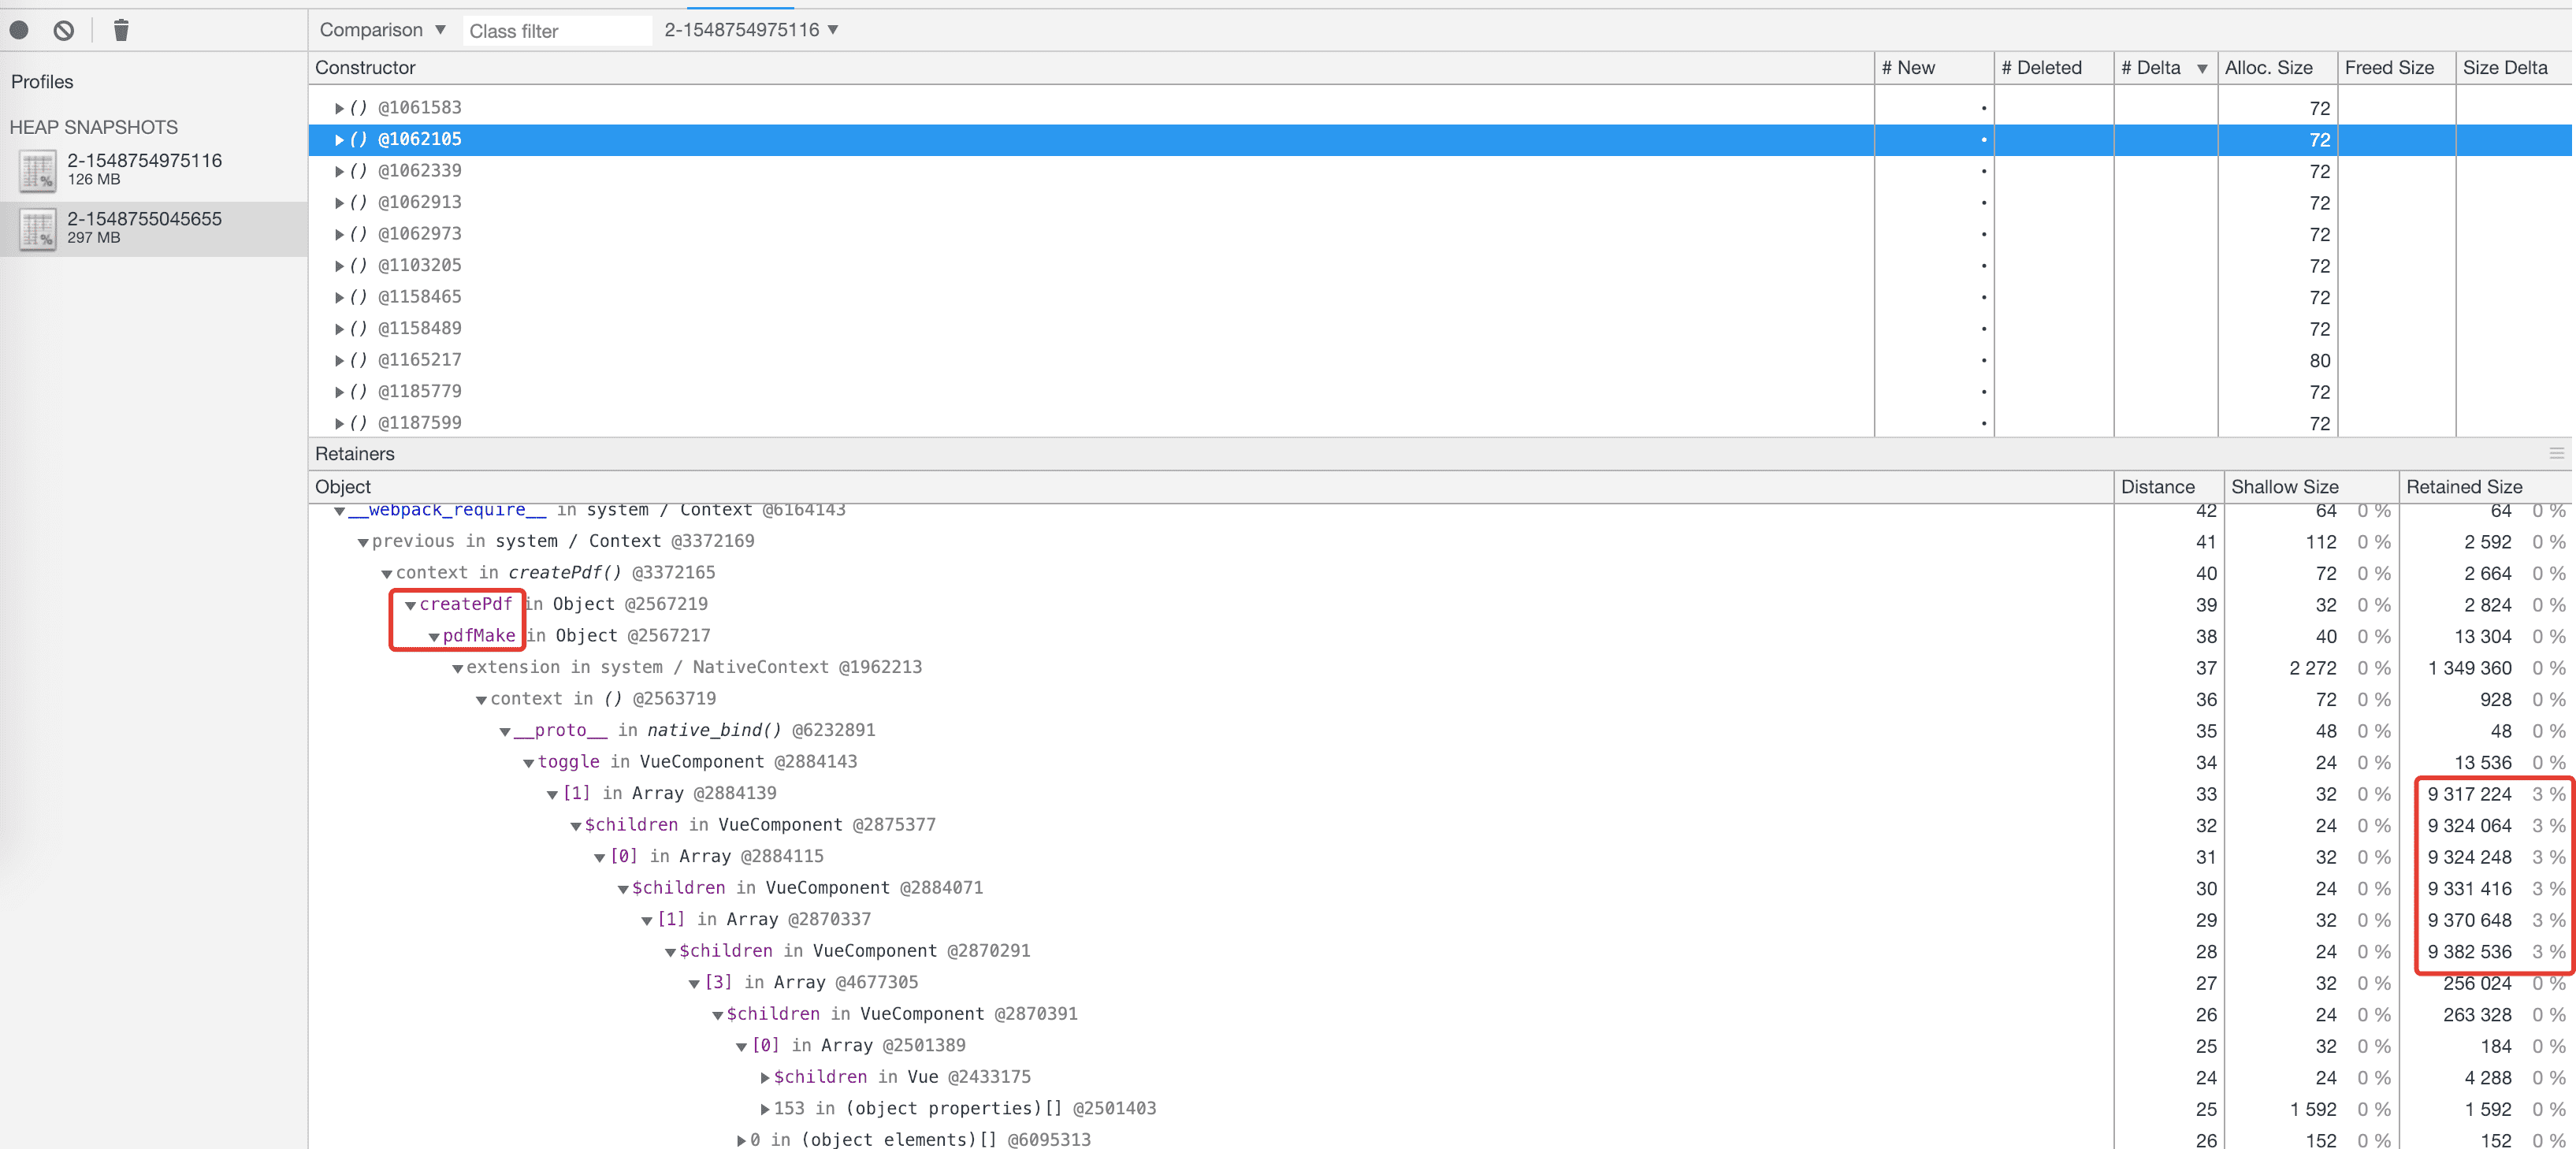
By Comparison option via Chrome Dev Tools you can detect memory delta between heapdumps
The most important thing is to determine the leak - when analyzing it is most useful to study the closure section, it may contain useful information. Next, in the screenshot, we see a percentage increase Retained size:
Autocannon Benchmark
Instead the Yandex Tank your can use the Autocannon is fast HTTP/1.1 benchmarking tool written in Node.js
$ # Send requests to localhost:3000 during 10 seconds
$ npx autocannon -c 1 -d 10 localhost:3000
Dmitry Schegolihin writes about his front-end experience for platforms Magento2, Vue Storefront and performance optimizations. I help businesses earn more by developing and optimizing web apps.