Overloaded
ELK stack setup via udp protocol
January 11, 2019
In this tutorial we try send to Logstash instance a test data via UDP protocol. I’m new to this ELK (Elastic Logstash Kibana) stack and many new questions for me. The best varinat try in practice.
In next we we will use the predefined ELK images based on Docker.
git clone git@github.com:deviantony/docker-elk.git
cd docker-elk && docker-compose up --build -d
After up all ELK containers need check Logstash status. Easy way:
echo "Hello Logstash" | nc localhost 5000In another way will use nodejs script send-tcp.js. You can edit the Logstash values for host and port as you need.
/* globals require:true, console:true, process:true */

// This script will send a message to a [logstash](http://logstash.net/)
// server using the [TCP input](http://logstash.net/docs/1.1.13/inputs/tcp)
// and then quit. If there is no listener, it will just quit.

'use strict';

var net = require('net');

var logHost = '127.0.0.1'
  , logPort = 5000
  , sender = require('os').hostname();

var conn = net.createConnection({ host: logHost, port: logPort }, function() {
  var message = {
    '@tags': ['nodejs', 'test']
  , '@message': 'tcp test '
  , '@fields': {'sender': sender}
  }
  conn.write(JSON.stringify(message));
  process.exit(0);
})
.on('error', function(err) {
  console.error(err);
  process.exit(1);
});
Execution this script:
node send-tcp.jsNow we can check Elastic indexies and see new Logstash index. For this porpose is cool extension Elastic Head for Google Chrome.
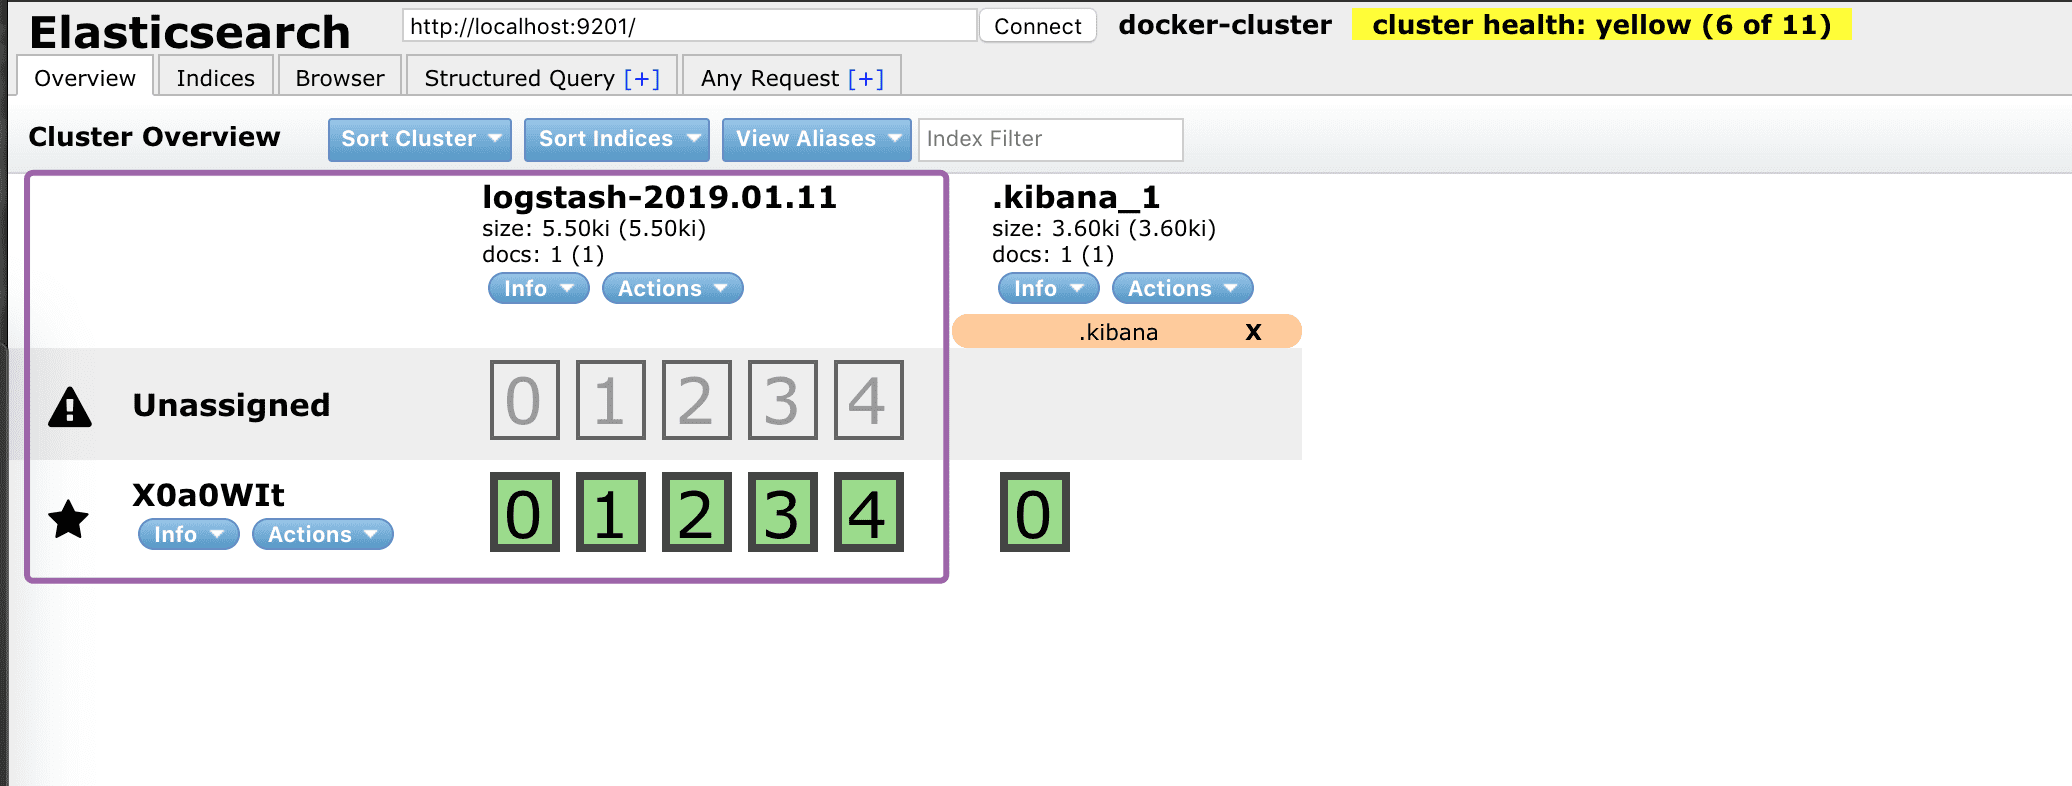
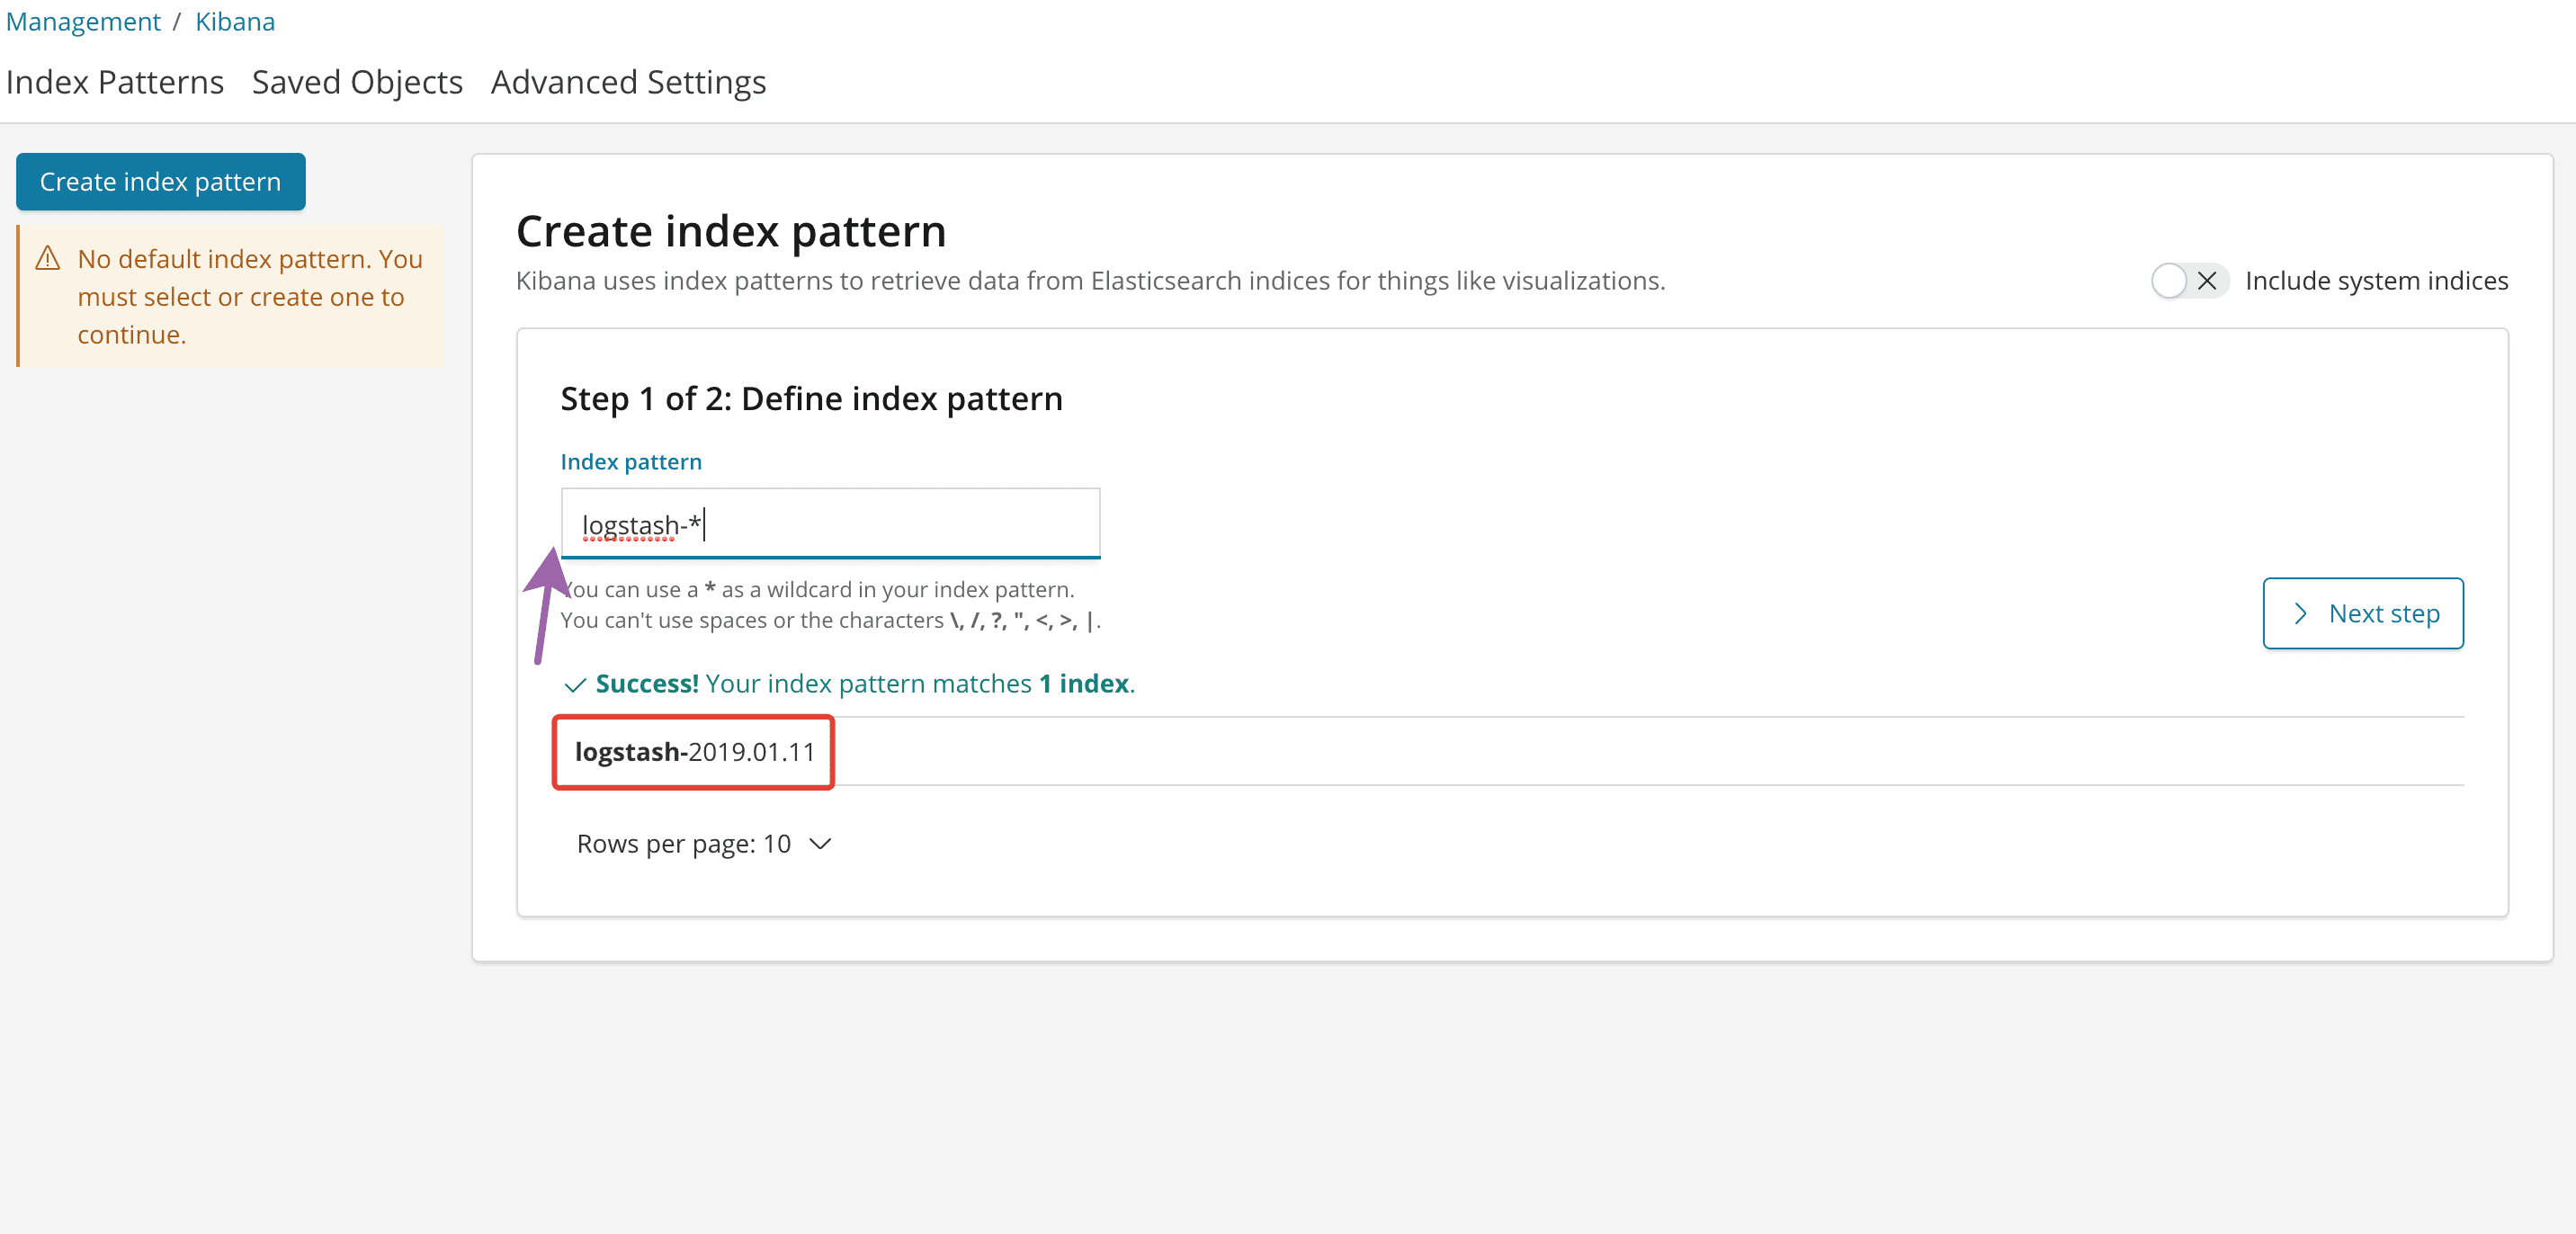
Go to Kibana in browser with standard port http://localhost:5601 and see detected the Logstash index:
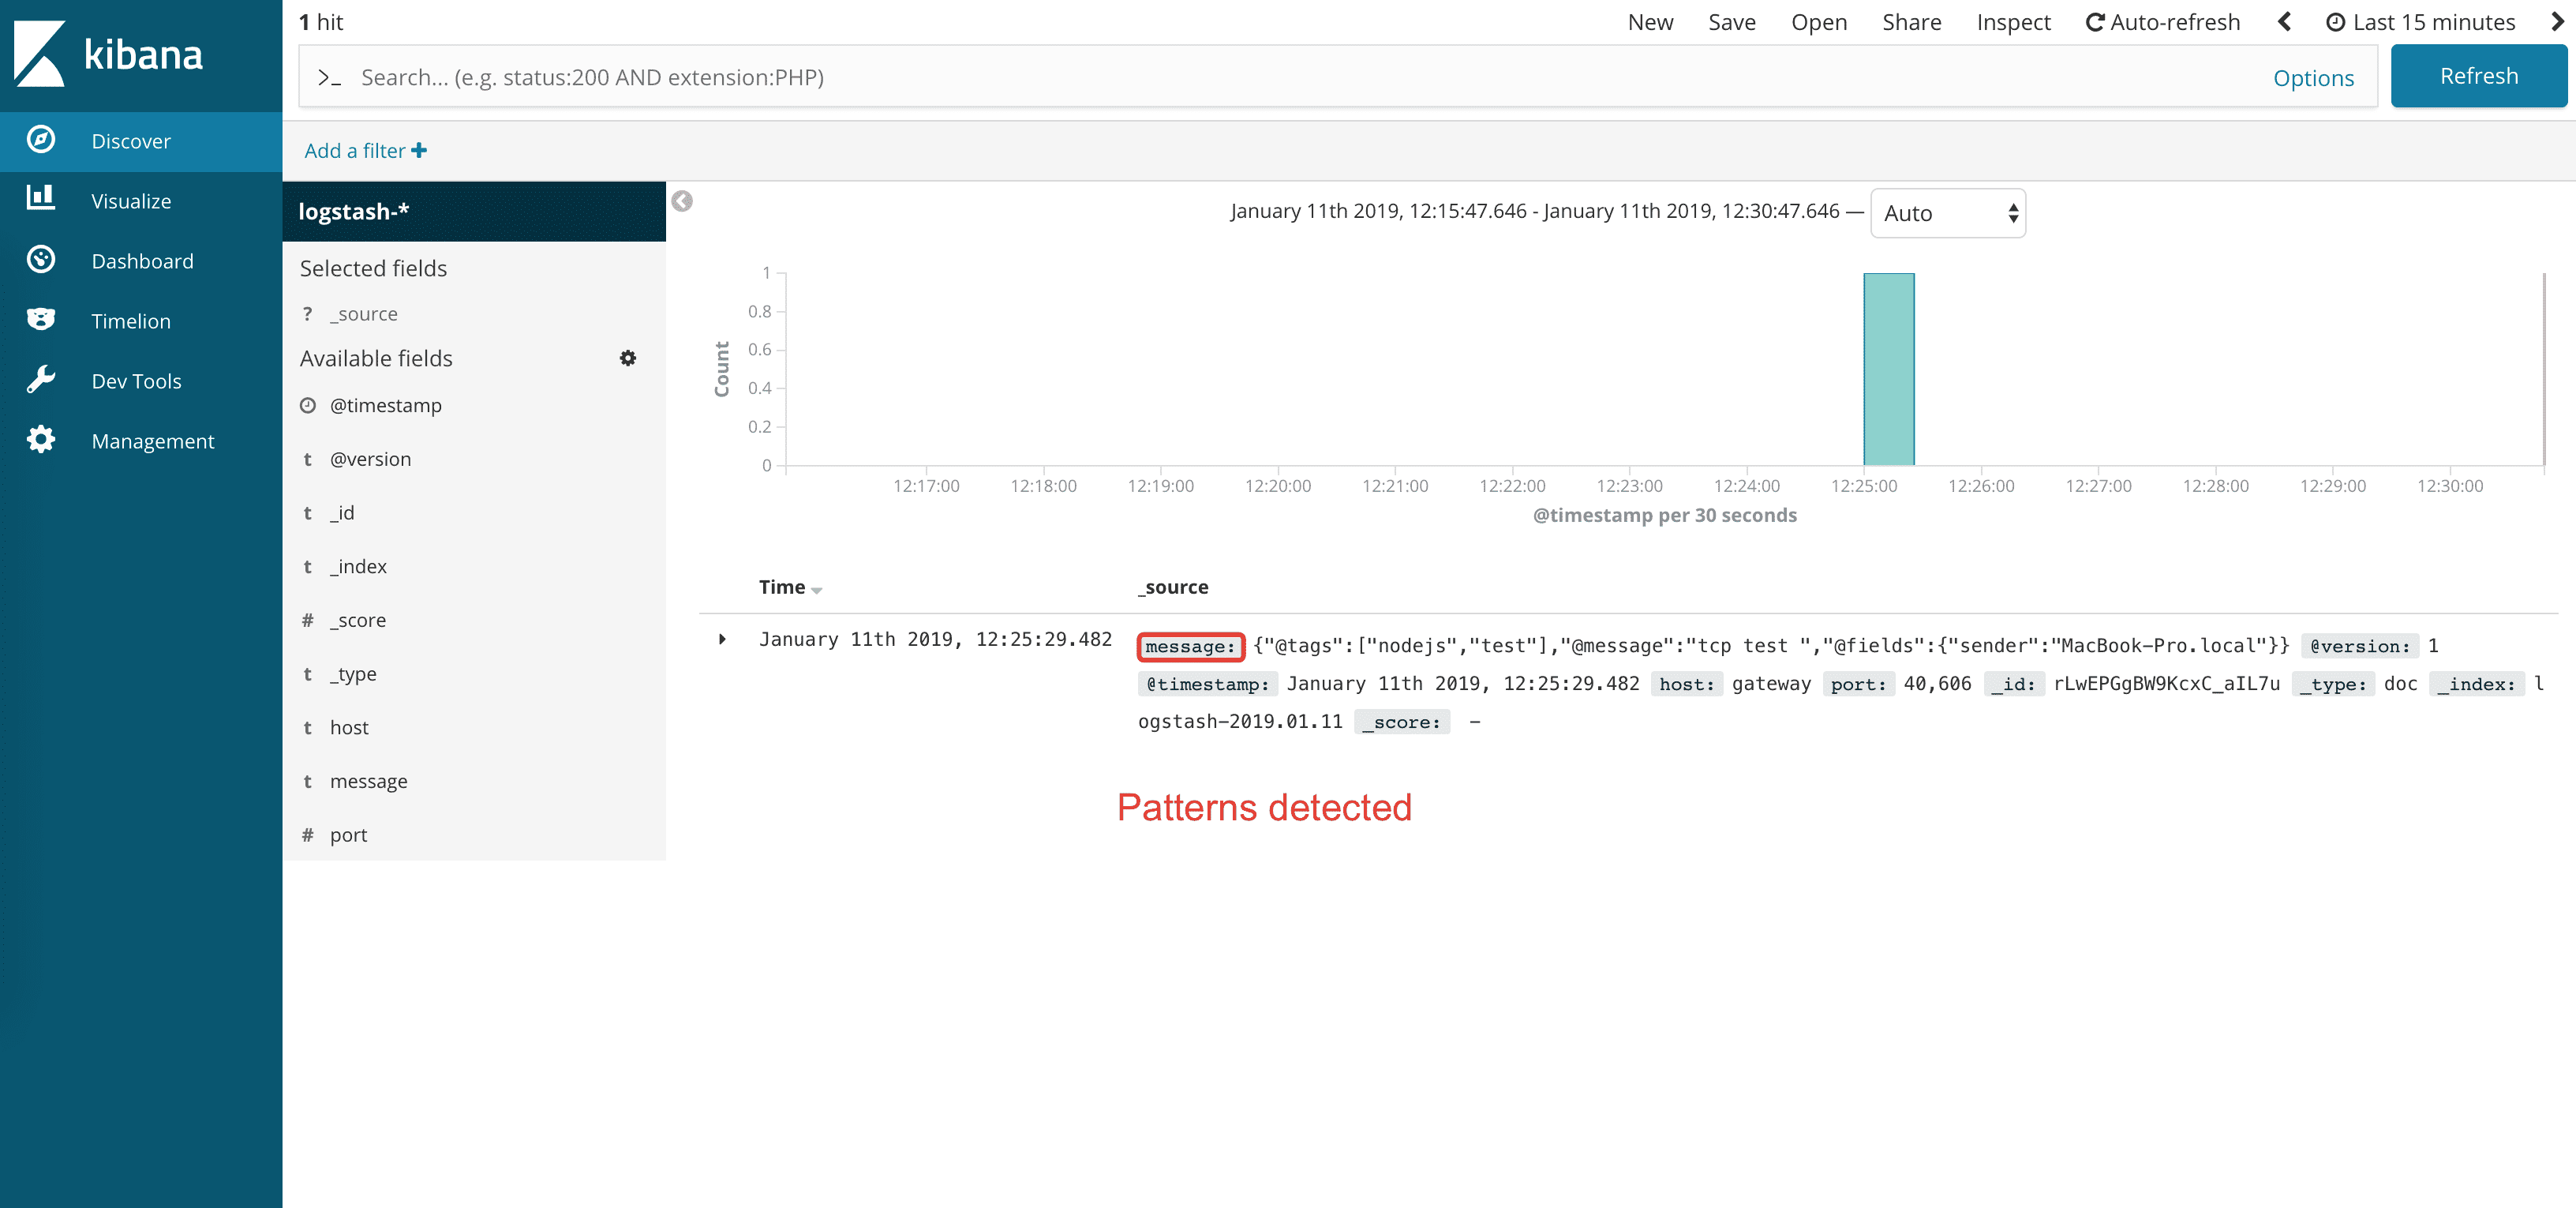
After configure Logstash index we can use the Discover tab for visualize search:
Setup UDP transport
For more info https://www.elastic.co/guide/en/logstash/current/plugins-inputs-udp.html
First step we install the UDP Plugin for Logstash container - to logstash/Dockerfile:
# Added UDP Plugin
RUN logstash-plugin install logstash-input-udp
Setup the UDP input in logstash/pipeline/logstash.conf:
input {
udp {
port => 5000
}
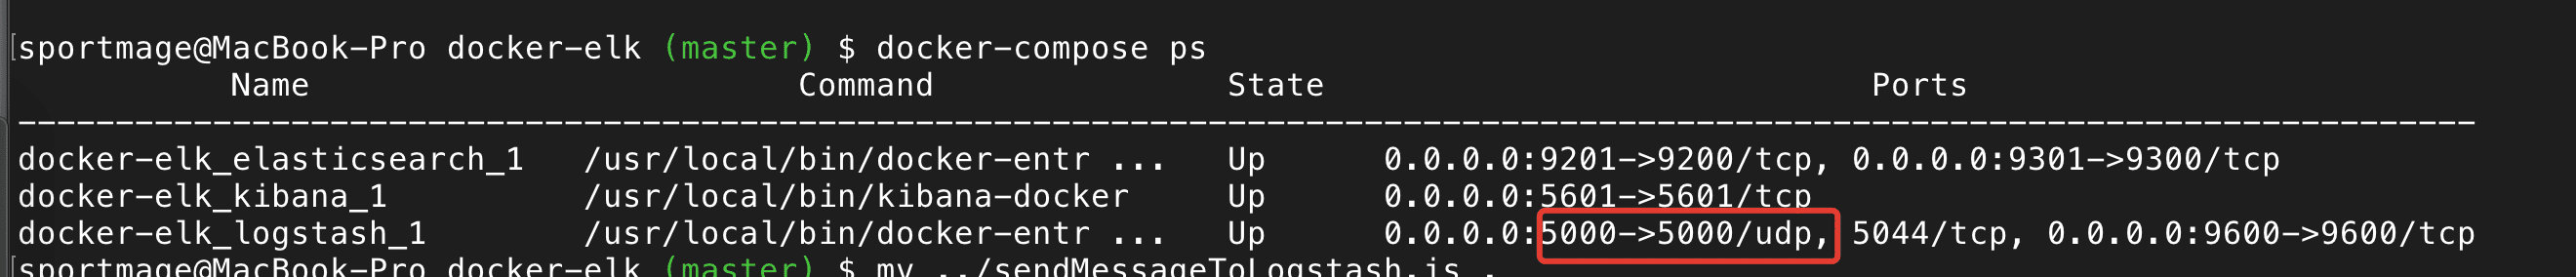
}And setup the UDP port in docker-compose.yml:
logstash:
    ...
    ports:
      - "5000:5000/udp"
Then need rebuild docker containers:
docker-compose up --build -d
For check UDP transport we use send-udp.js script:
/* globals require:true, console:true, process:true */

// This script will send a message to a [logstash](http://logstash.net/)
// server using the [TCP input](http://logstash.net/docs/1.1.13/inputs/tcp)
// and then quit. If there is no listener, it will just quit.

'use strict';

var udp = require('dgram');

var buffer = require('buffer');

// creating a client socket
var client = udp.createSocket('udp4');

//buffer msg
var data = Buffer.from('udpmessage');

//sending msg
client.send(data, 5000,'localhost',function(error) {
  if (error) {
    client.close();
  } else {
    console.log('Data sent !!!');
    client.close();
  }
});
You can configure the logstash index created in ES (use only one as example, default format index => "%{[program]}-%{+YYYY.MM.dd}")
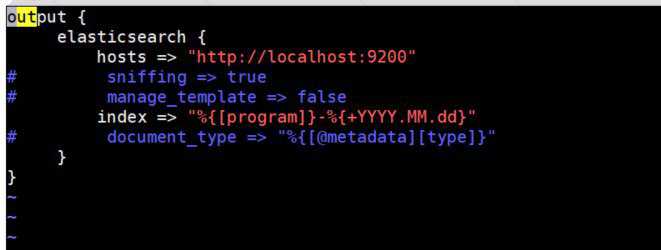
For example:
index => "application-%{+YYYY.MM.dd}"
Dmitry Schegolihin writes about his front-end experience for platforms Magento2, Vue Storefront and performance optimizations. I help businesses earn more by developing and optimizing web apps.